


Identifying and Retargeting
Superfans.

The What
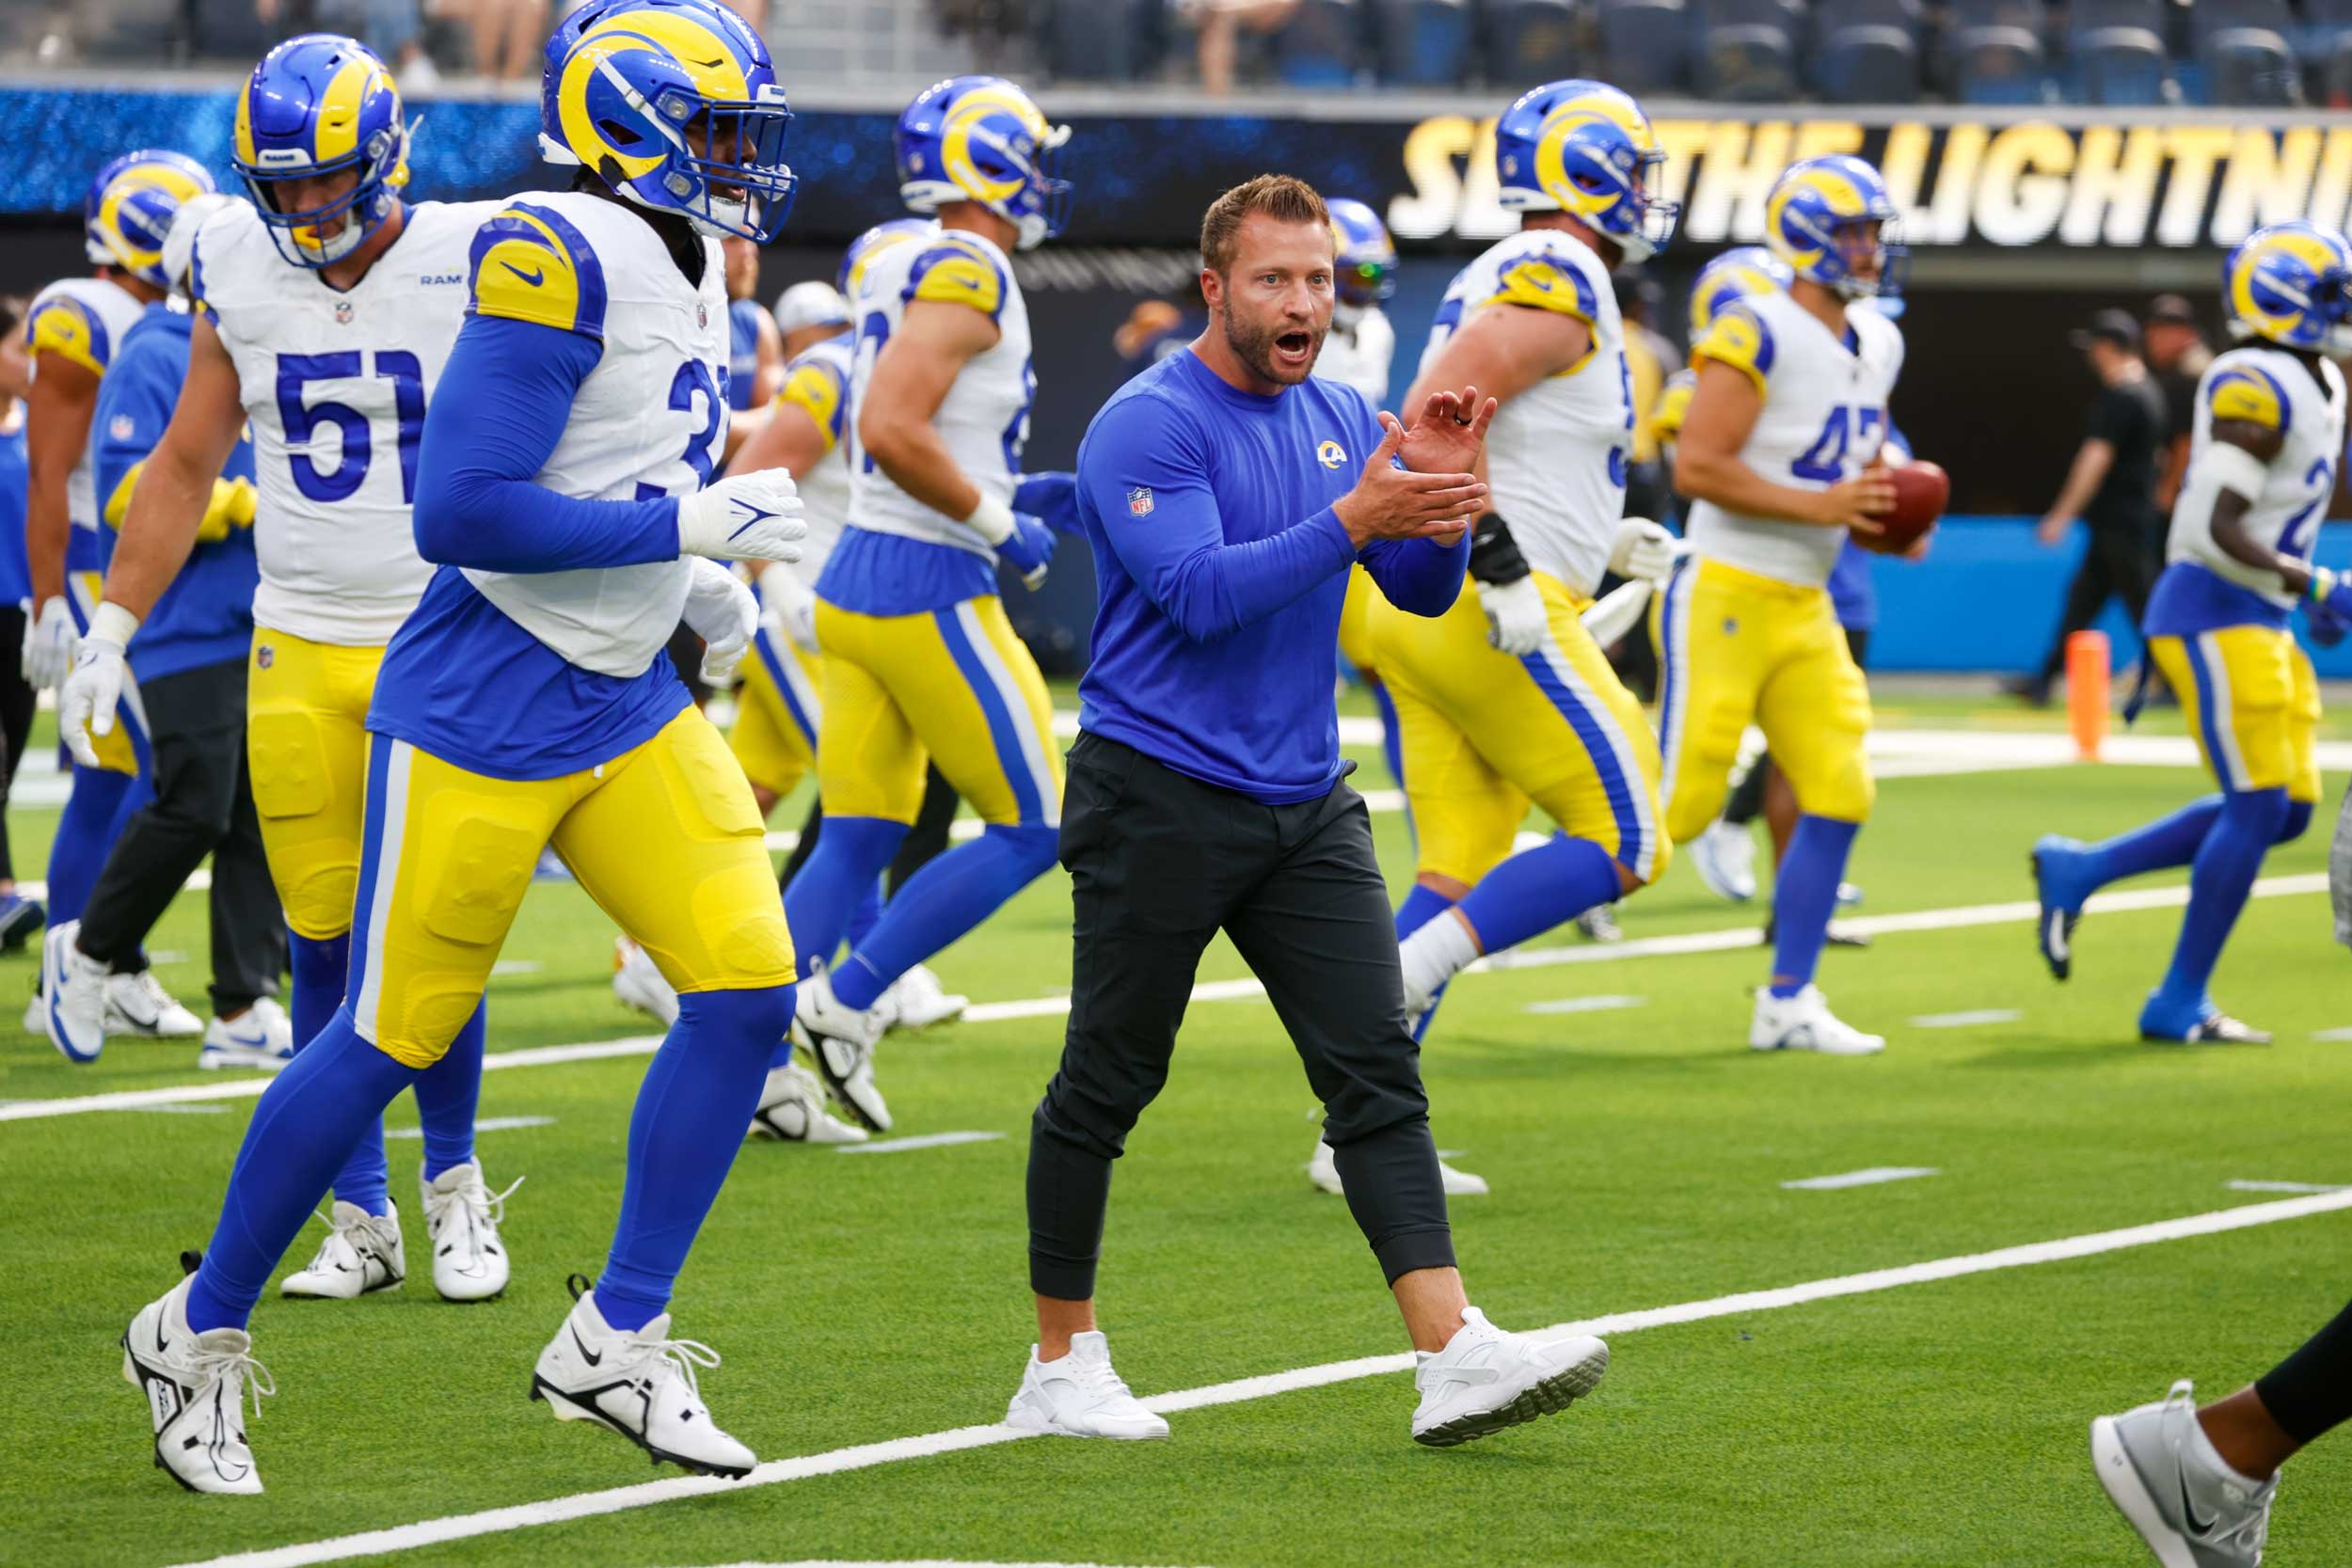
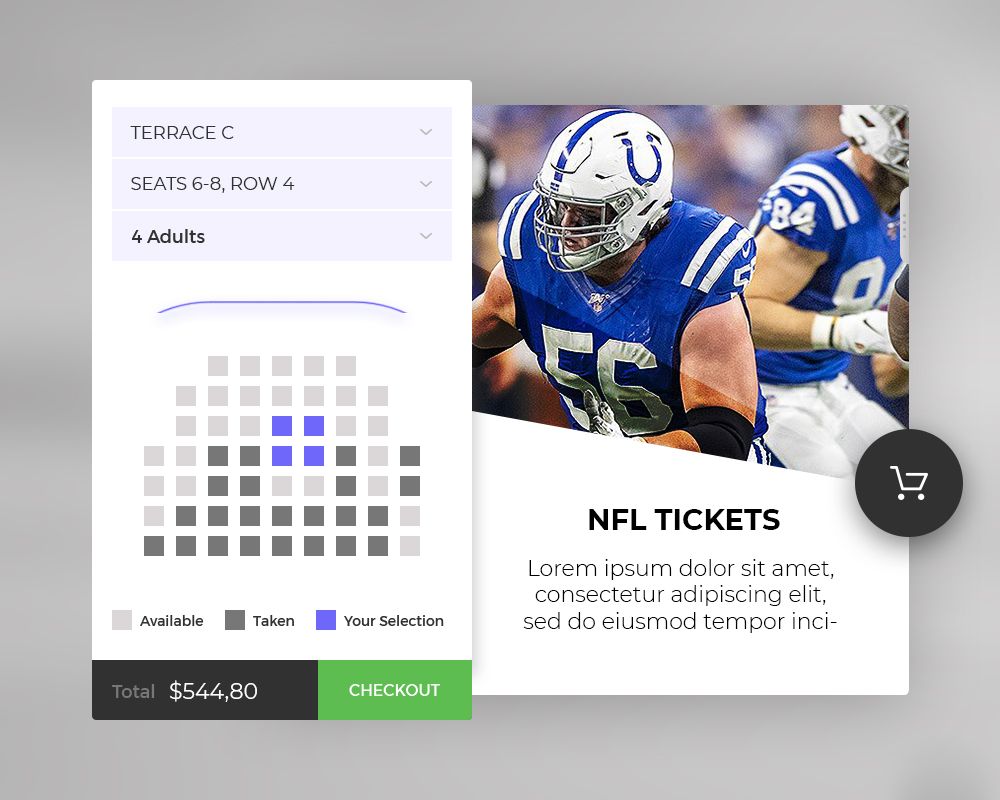
A national campaign for a national football team.
Amidst the construction of a new multi-million-dollar football stadium, an NFL team needed to ensure strong ticket sales going into the next season. Leveraging our proprietary data, we were able to provide insights and activation that drove a 16% conversion rate on our campaign, resulting in more than $3M in ticket sales.
Services
- Data Insights & Analysis
- Market Research
- IP Targeting
Our Approach
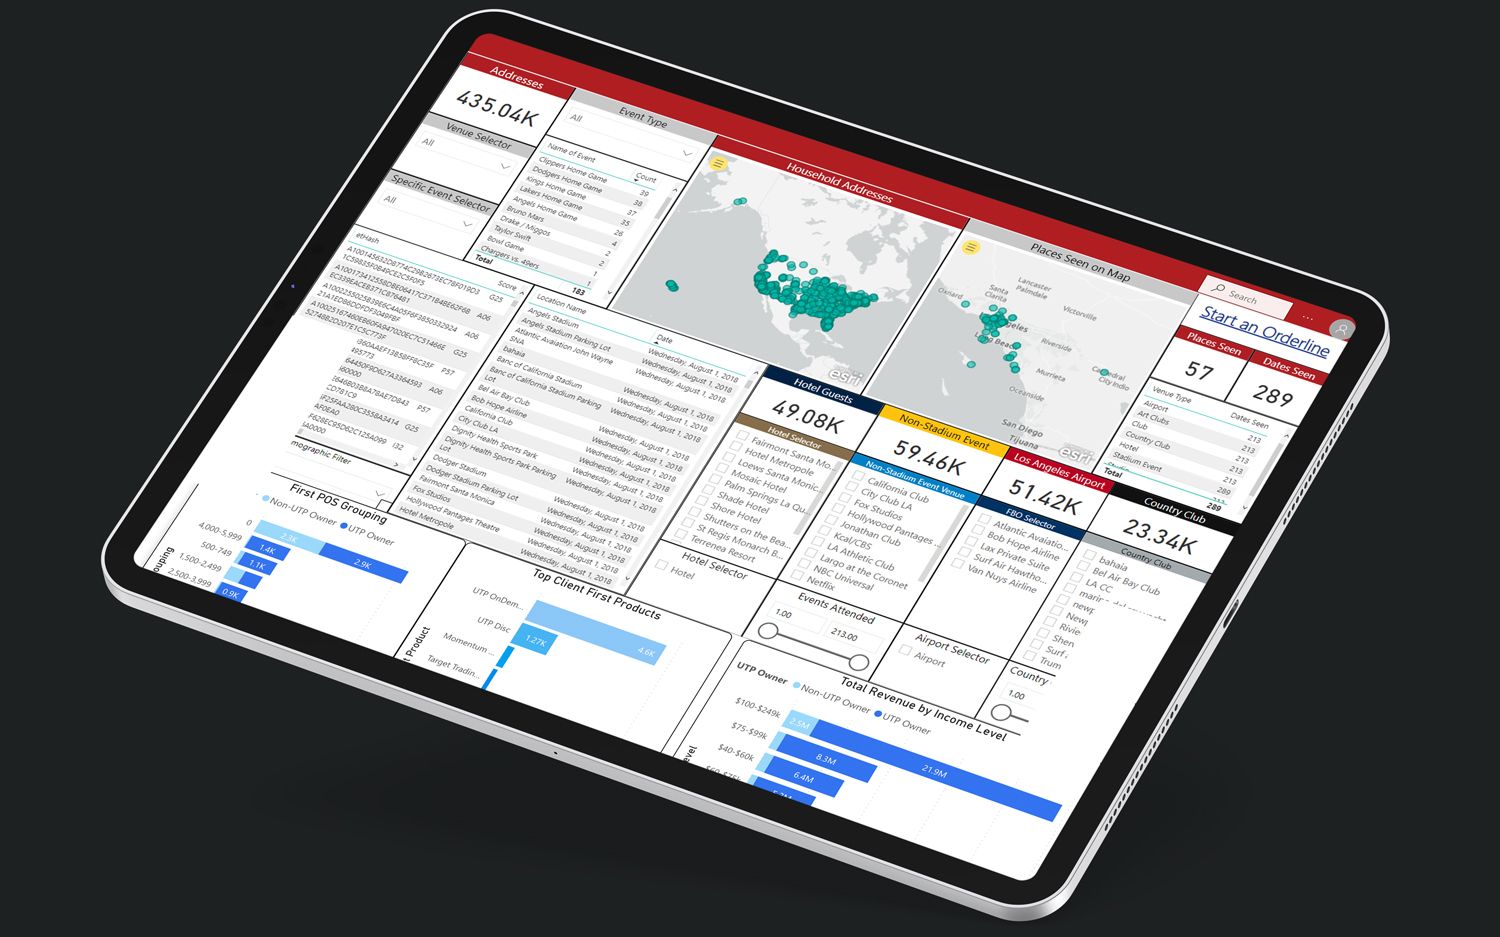
To identify and target their higher income, higher affinity consumers, the sports team needed concrete insights, and a data platform to identify the right people to advertise season tickets to. Ultimately, our proprietary R&D Dashboard, a consumer-data aggregator that shows both online and offline data, proved to be effective in meeting the task at hand: Sell more tickets to the right customers.
Data Insights & Analysis
We applied our patented algorithms in combination with our massive amounts of location-based data to segment the football team’s customer list based on location indicators. Our tech identified which consumer devices had been seen within high-income establishments such as private airports, country clubs, exclusive hotels and restaurants. After pulling this, we also combined data around how often these consumers were seen at team events.

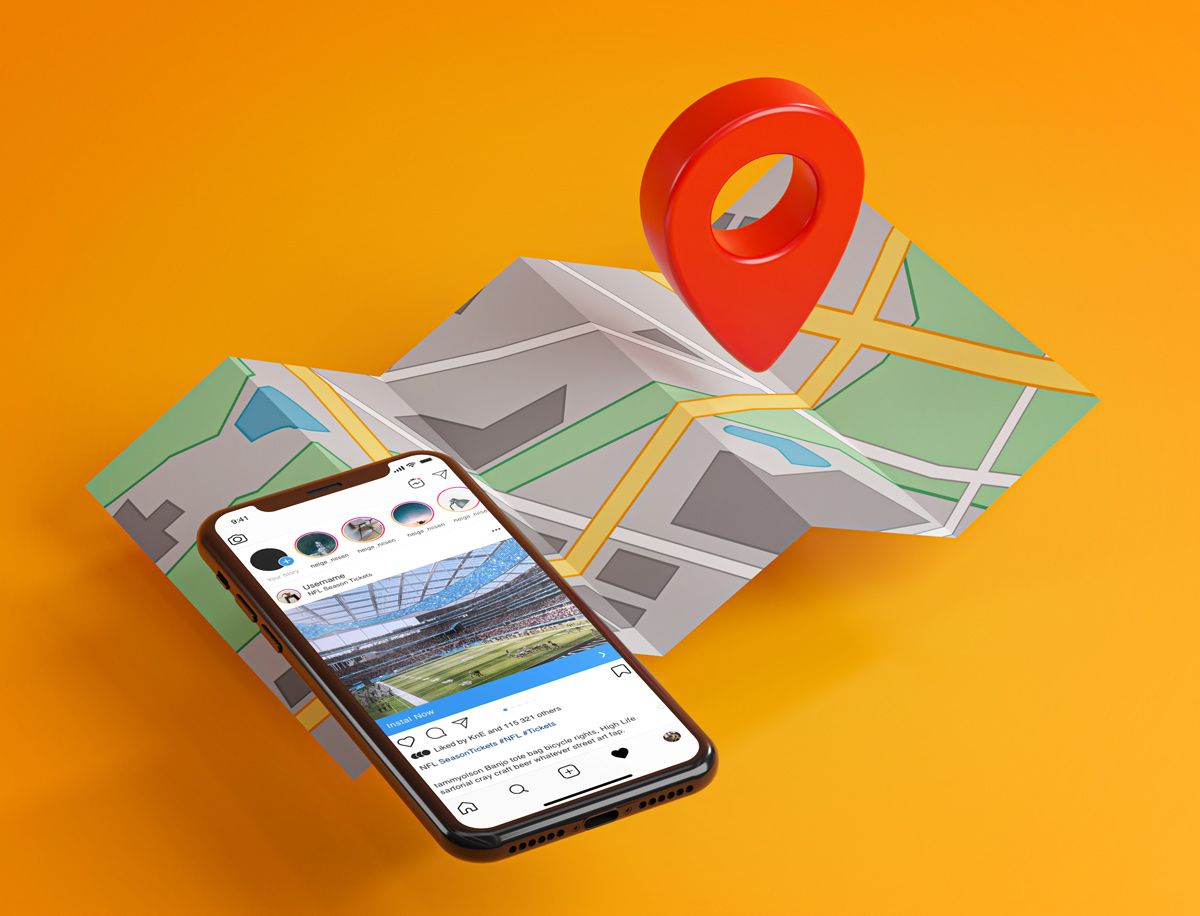
Data. Creative. AdTech.
We applied our findings to marry both wealth and team appreciation to show authenticated consumer insight. To do this, we separated the team’s CRM list based on a level of 1 to 7, identifying which consumers were most likely to purchase both high-price and high-affinity tickets. And thus, were able to market and advertise accordingly.
The Results
- $3 MILLION TOTAL SALES
- 16% CONVERSION RATE ON PAID CHANNELS
- 31% ATTRIBUTION SEASON TOTAL TICKET SALES


see our work